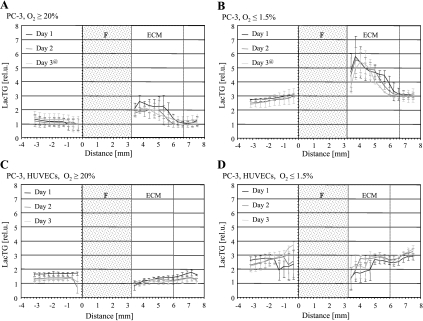
Figure 8.
Relative levels of lactate and triglycerides (LacTG) along the sample obtained for (A) oxygenated PC-3 cells, (B) hypoxic PC-3 cells, (C) PC-3 cells in the presence of HUVECs under oxygenated conditions, and (D) PC-3 cells in the presence of HUVECs under hypoxia. Values, presented as mean ± SEM, are from localized 1D 1H MR spectra averaged over four experiments for each condition, unless for time points marked with an at sign (@), which were averaged over three independent MR experiments. The base of the ECM gel chamber was defined as 0 mm. F represents the thickness of filter material forming the base of the ECM gel chamber; ECM, the thickness of ECM gel at the start of the MR experiments.

