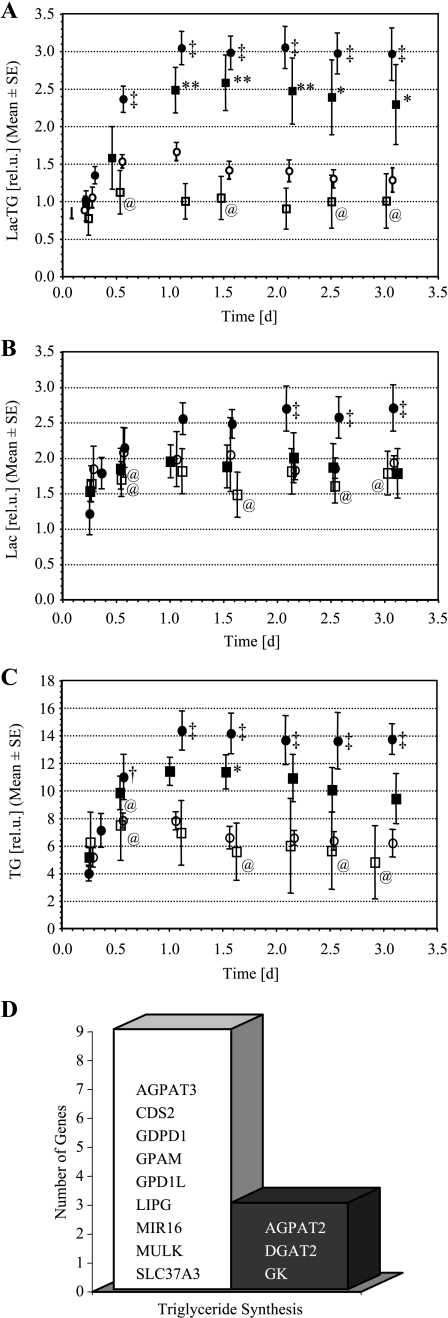
Figure 9.
Intracellular (A) LacTG, (B) Lac, and (C) TG, calculated from global 1D 1H MR spectra. Note that the relative scale in (A) acquired with a stimulated echo acquisition mode-based pulse sequence differs from (B) and (C), which were acquired with a lactate-edited SE-based pulse sequence. (□) PC-3 cells alone under oxygenated conditions (n = 4); (○) PC-3 cells in the presence of HUVECs under oxygenated conditions (n = 4); (■) PC-3 cells alone under hypoxia (n = 4); (●) PC-3 cells in the presence of HUVECs under hypoxia (n = 4). Values represent mean ± SEM. At sign (@), time points at which values of only three independent experiments were available. **P < .05, *P < .1, □ versus ■; ‡P < .05, †P < .1, ○ versus ● (Mann-Whitney U Test). (D) Genes related to triglyceride synthesis that have been downregulated (open bar) and upregulated (closed bar) as a result of 48-hour hypoxic (1.0 ± 0.2% O2) exposure of PC-3 cells in tissue culture compared to oxygenated control cells (20% O2) (n = 2).

