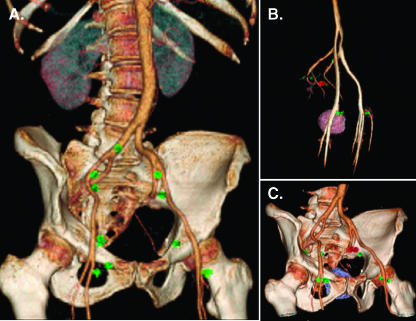
Figure 5.
Three-dimensional (3D) rendered images following IV administration of nanoparticles. (A) 3D rendered image from a patient shows multiple benign nodes (in green) plotted in relation to pelvic vessels and bony pelvis. (B) 3D rendered image of another patient shows malignant node (in red) in relationship to pelvic vasculature along with other benign nodes. (C) Same node in B is shown in relationship to pelvic vessels, bony pelvic, and the prostate gland.

