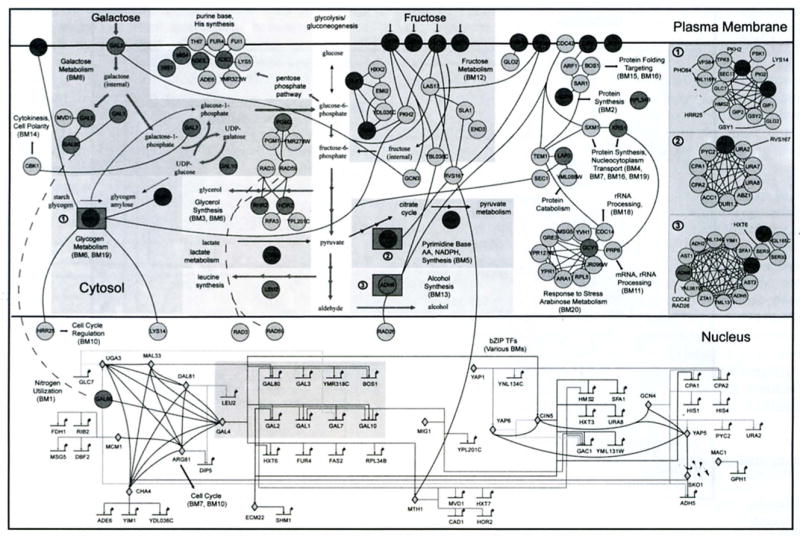
Fig. (3).

The yeast galactose utilization network derived from high-throughput global assays. Shaded background boxes in the cytosol delineate the known metabolic pathways. Transcription factors in the nucleus are represented by diamonds (genes within the grey box are the regulatory genes in Fig. 2). All other proteins (circles) arc located according to their sub-cellular localizations (plasma membrane, cytosol and nucleus). Colors (not shown) can be used to indicate increase, decrease and no significant change in gene expression when the carbon source is changed from raffinose to galactose (see (12] for color). The three numbered squares shown at the right represent complexes. Numbers preceded with BM mark functionally clustered biomodules. Short black arrows indicate communication between the modules.
