Figure 2.

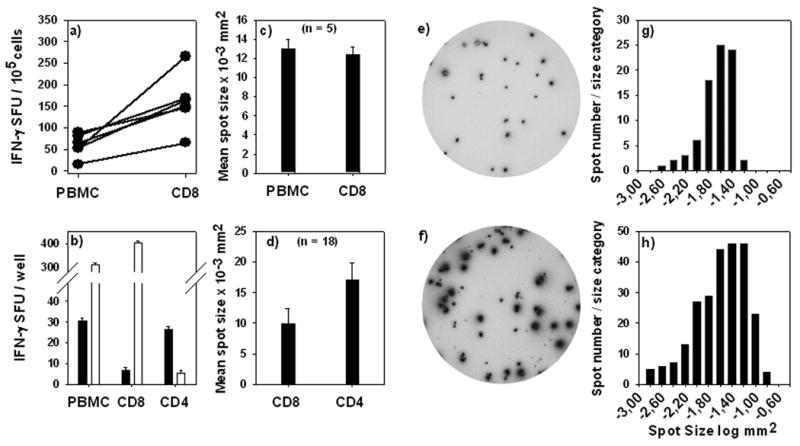
CD8+ cell-derived IFN-γ spots are smaller than CD4+ T cell-derived IFN-γ spots. (a) Spot numbers obtained for PBMC or purified CD8+ cells were normalized for 100,000 cells and corresponding data points are connected. (b) CEF-peptide induced IFN-γ spots are CD8+ cell derived while protein-antigen-induced IFN-γ spots are produced by CD4+ cells. PBMC, CD8+ and CD4+ enriched cells were tested for either mumps protein (solid bars) or EBV BMLF 1 259 peptide (open bars). Cell numbers of CD8+ and CD4+ cells were selected as specified in Materials and Methods matching the frequency of these cells in the PBMC. (c) Mean IFN-γ spot size induced by CEF peptides in PBMC vs. purified CD8+ cells. (d) Mean IFN-γ spot size produced by CD8+ and CD4+ cells. IFN-γ spot size distributions induced by the individual CEF peptides and the protein antigens mumps or candida were compared. The bars show the mean ± SD of spot sizes established in 18 donors for each purified cell type as indicated on the x-axis. A representative example of CEF-peptide-induced CD8+ cell derived IFN-γ spots is shown (e). Spot size distribution for such CD8 cell-derived spots from triplicate wells is shown in (g). A representative example of protein antigen-induced CD4 cell derived IFN-γ spots is shown in (f). The spot size distribution for triplicate wells of CD4 cell derived spots is shown in (h).
