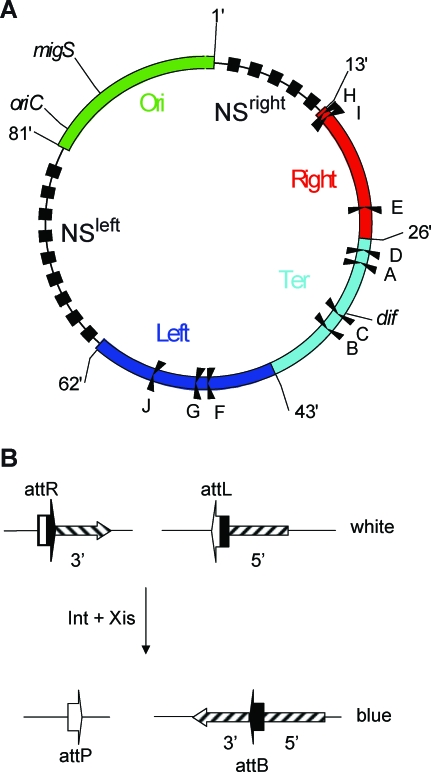
Figure 1. Macrodomain Organization of the E. coli Chromosome.
(A) Schematic representation of E. coli MDs and nonstructured (NS) regions. The circle represents the genetic map of the chromosome. Colored bars represent the different MDs (with their coordinates indicated in minutes), and interrupted black bars schematize the two NS regions. The ten Ter sites (from A to J), replication origin oriC, migS, and dif sites are indicated.
(B) Integrative and excisive recombination promoted by Int + Xis. In the presence of Int and Xis proteins, recombination between attL and attR sites generates attB and attP sites. It recreates a lacZ coding sequence allowing phenotypic detection of recombined fragments.

