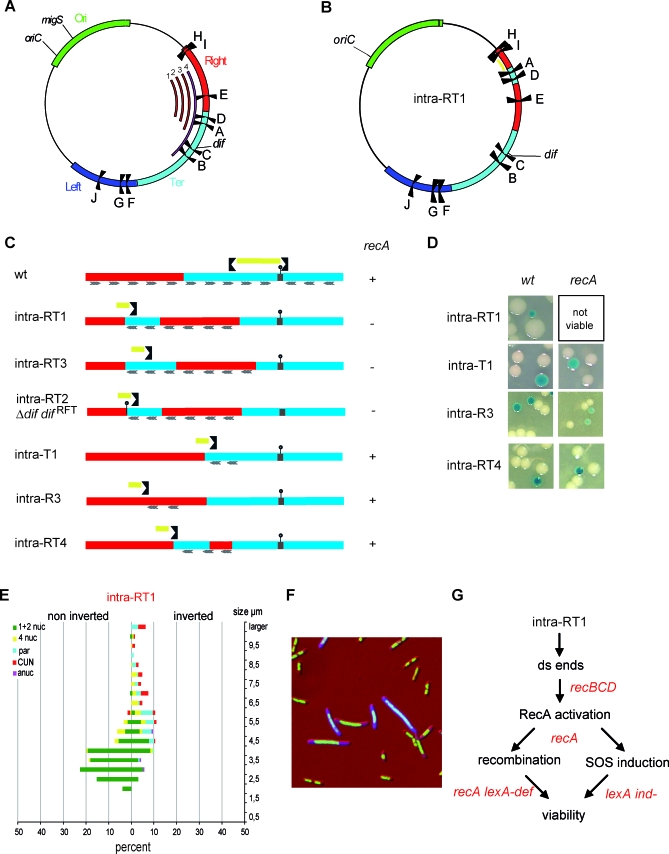
Figure 4. Intrareplichore Inversions between the Right and Ter MDs.
(A) Schematic representation of the E. coli chromosome showing the MDs (Ori in green, Right in red, Left in blue, and Ter in cyan), the ten Ter sites (from A to J), oriC, and dif. The numbered red arcs indicate the position and extent of fragments inverted in the strains Intra R-T1 to −3 (1 to 3, respectively), and the pink arc (number 4) shows the fragment inverted in the Inter R-T2 strain.
(B) Schematic representation of the E. coli chromosome upon an intrareplichore inversion that causes the intermingling of Right and Ter MDs (strain Intra R-T1). The MDs are colored as in Figure 1, and the replication fork trap is indicated in yellow. The different Ter sites, oriC, and dif are indicated.
(C) Linear genetic maps of the Right and Ter MDs upon various intrareplichore inversions. The inverted Ter site defining the displaced replication fork trap is shown, and the replication fork trap is indicated in yellow. The dif site is indicated by a small stick, and the wt replichore junction by a grey box. Inverted KOPS are indicated by rafters (1 for 100 kb). Viability in a recA background is indicated by a plus sign (+) beside the map.
(D) Colonies of strains carrying chromosomes with various intrareplichore inversions as indicated in (C). Colonies were obtained in a wt or recA genetic background.
(E) Microscopic analysis of strain Intra R-T1 as described in Figure 2.
(F) Cells from strain Intra R-T1 with an inverted configuration were transformed with a plasmid expressing gfp under the PsfiA promoter. Nucleoids of cells expressing SOS appear as blue (see Figure S3 for unmerged pictures).
(G) Pathways required for viability of the inverted configuration. Genetic backgrounds in which inverted configuration did not give rise to viable colonies are indicated in red.

