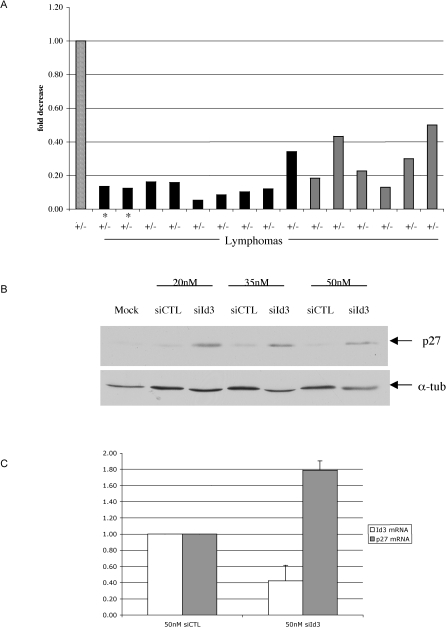
Figure 2. p27 Transcript Is Regulated in p27 +/− Lymphomas and Normal Cells.
(A) p27 transcript levels in p27 +/− thymus and p27 +/− lymphomas were determined by quantitative RT-PCR using probe and primer sequences at the border of exons 1 and 2. The amount of RNA in each sample was normalized to HPRT1 gene expression. The fold change observed is relative to the p27 transcript levels in the p27 +/− normal thymus indicated by the striped bar. The p27 low lymphomas from Figure 1A are shown in black, and lymphomas with higher p27 protein are shown in gray. An asterisk marks lymphomas with retroviral insertions near Id3.
(B) p27 protein levels increase dependent on the presence of the Id3 siRNA. α-tubulin expression is shown as a loading control.
(C) Quantitative RT- PCR indicates Id3 siRNA decreased Id3 mRNA and increased p27 mRNA abundance. HPRT1 mRNA was used to normalize RNA amounts in each sample. All primer-probe sets are located at exon borders.
doi:10.1371/journal.pgen.0030219.g002

