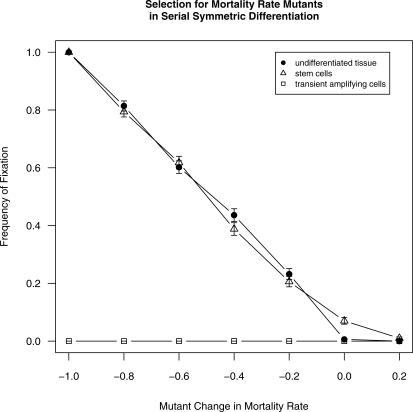
Figure 3. Frequency of Fixation (Mutant Reaches >90% of Cell Population) for Mutations Affecting Cell Mortality Rate.
Frequency of fixation when introduced into nondifferentiating populations (filled circles), stem cells (triangles), and TACs (squares). Bars show standard errors. Because they did not vary, results for all three transient amplifying stages are pooled. Values on horizontal axis show mutant cell's value of d relative to initial value of 0.05. Mutant values of d thus ranged from (0.05 − 100% = 0) to (0.05 + 20% = 0.06).

