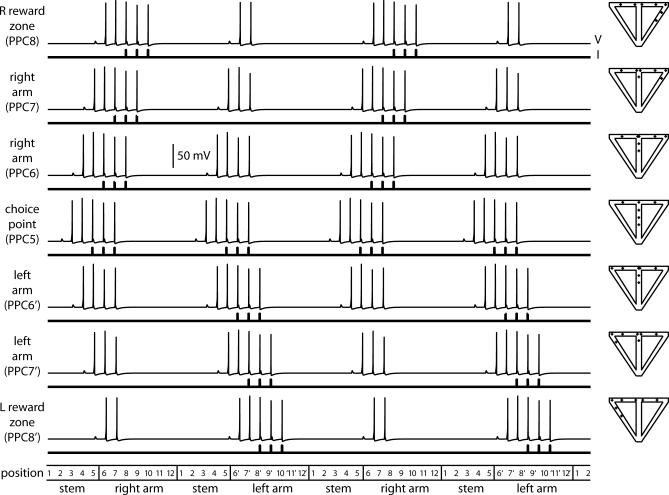
Figure 4. Forward Association from the Choice Point.
Left: time-series plots for the PPCs representing the choice point and the three positions to the right and left of the choice point. For each cell, the bottom trace is the input current (200 pA) and the top trace is the voltage response. Activity spreads symmetrically from the choice point cell to the cells representing the right and left arms of the maze. Right: place fields for the cells depicted on the left. The dots represent spikes, showing where the animal was located when the cell fired.

