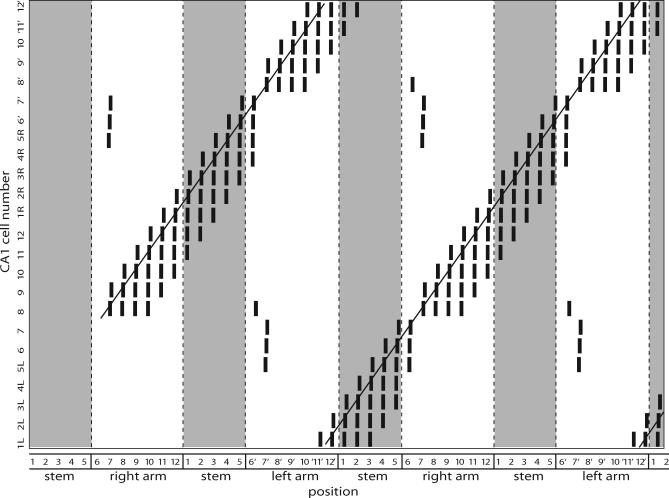
Figure 9. The CA1 Network.
Raster plot showing spiking patterns for the entire CA1 network (including the initial transient). Cell number is plotted against position, and a vertical bar indicates a somatic spike when the rat is in a particular position. Cells in the stem are splitter cells: CA1 cells 1–5 R and 1–5 L fire only after right-turn and left-turn trials, respectively. The lines show how the rat can use the output of its CA1 cells to determine correct trajectories through the maze.

