
Figure 6.
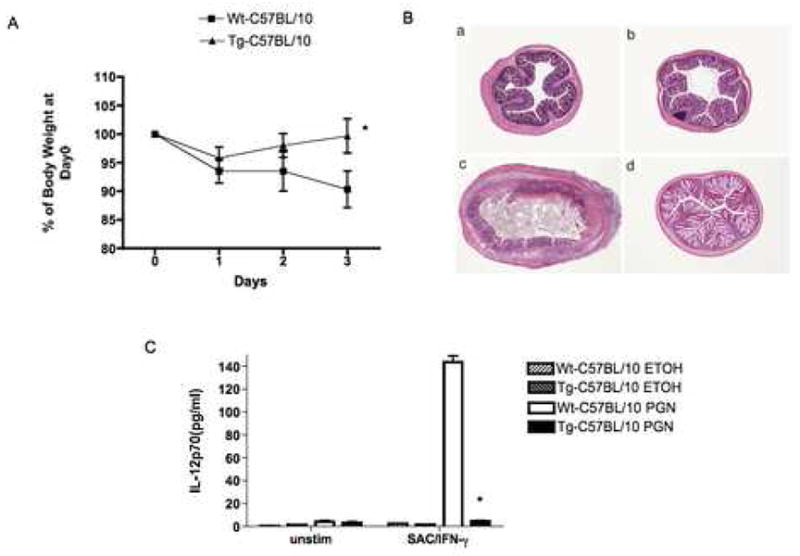
NOD2-Tg mice exhibit resistance to the induction of PGN-colits. C57BL/10 NOD2-Tg and littermate control (wild-type) mice were administered soluble PGN or ethanol alone (ETOH) per rectum. (A) Body weight changes (Mean± SD) of mice in each group (expressed as a percent of initial weight); on average, there were 10 mice in each group in two independent studies. Statistical differences between NOD-2 Tg and littermate control groups denoted by *, p < 0.05. (B) Representative H&E stained cross-sections of colons of mice at the time of sacrifice 3 days after PGN challenge (magnification: 25X); (a,c) littermate control mice administered ETOH alone or PGN respectively; (b,d) NOD2-Tg mice administered ETOH alone or PGN, respectively. (C) IL-12p70 production by LPMC obtained from mice 3 day after PGN or ETOH administration and cultured with Staphylococcus aureus (Cowan I) plus IFN-γ for 48h. Data are expressed as Mean ± SD from cells obtained from 10 mice in each group (derived from two separate studies). Statistical differences between NOD2-Tg and littermate control group administered PGN denoted by *, p < 0.05.