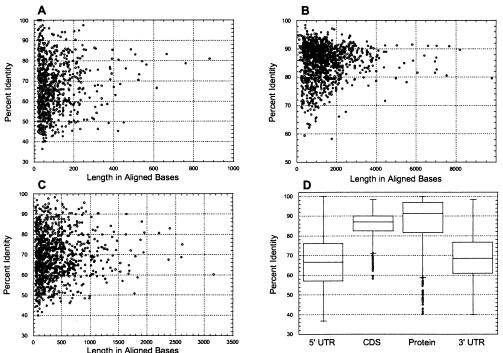
Figure 2.
Distributions of lengths and degrees of sequence conservation for 1,212 aligned orthologous rat and human mRNA and protein sequences. (A–C) Scatter plots of results for 5′ UTRs (A), CDSs (B), and 3′ UTRs (C). (D) Box plots of sequence conservation by region for aligned rat and human mRNAs and encoded proteins. For each category, the central box depicts the middle 50% of the data between the 25th and 75th percentile, and the enclosed horizontal line represents the median value of the distribution. Extreme values are indicated by circles that occur outside the main bodies of data.

