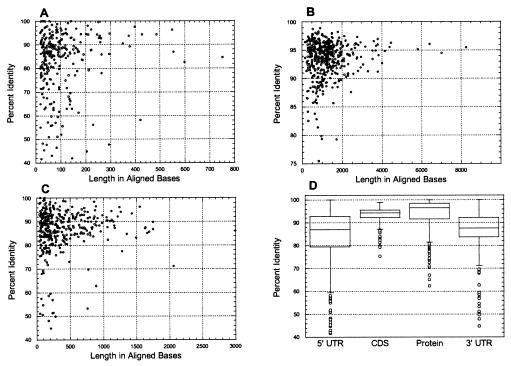
Figure 3.
Distributions of lengths and degrees of sequence conservation for 470 aligned orthologous mouse and rat mRNA and protein sequences. (A–C) Scatter plots of results for 5′ UTRs (A), CDSs (B), and 3′ UTRs (C). (D) Box plots as described in the legend to Fig. 2.

