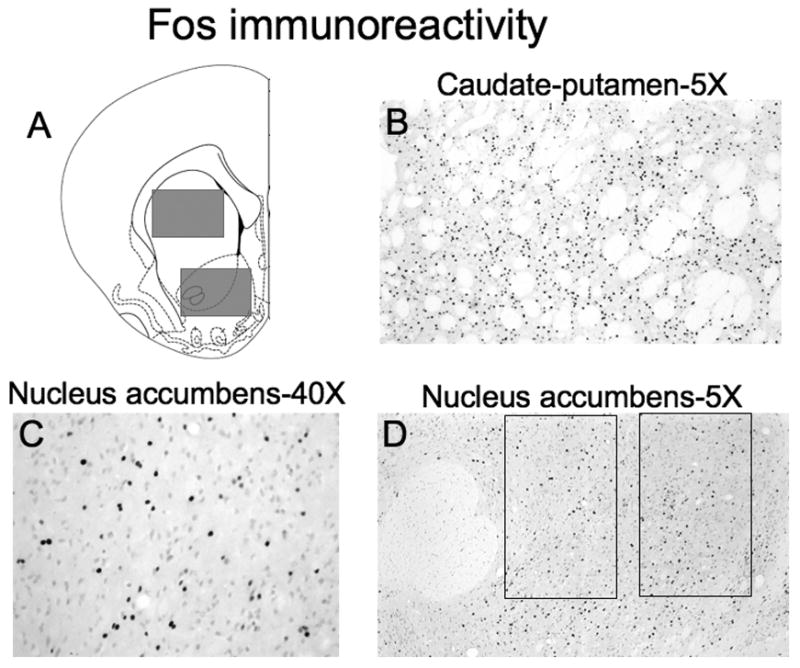
Figure 2.

(A) Schematic representation of brain regions captured for image analysis. Images were captured from coronal sections approximately 2 and 1 mm anterior to Bregma for nucleus accumbens and approximately 2, 1, and 0 mm anterior to Bregma for caudate-putamen. Fos-IR nuclei were quantified from images of the regions indicated with gray rectangles. The size of each image was 1.76 × 1.36 mm with a total area of 2.39 mm2. Drawings of coronal section and coordinates were obtained from Paxinos and Watson (1998). Photomicrographs (with 5X objective) of amphetamine-induced Fos-IR nuclei in (B) caudate-putamen and (D) nucleus accumbens following repeated amphetamine administration. The large round area of white matter in the left-hand side of the nucleus accumbens image is the anterior commissure. The two rectangles in the nucleus accumbens image indicate core and shell subregions quantified and shown in Figure 4; the size of each rectangle was 0.62 × 0.41 mm with a total area of 0.25 mm2. (C) Higher magnification photomicrograph (with 40X objective) of nucleus accumbens.
