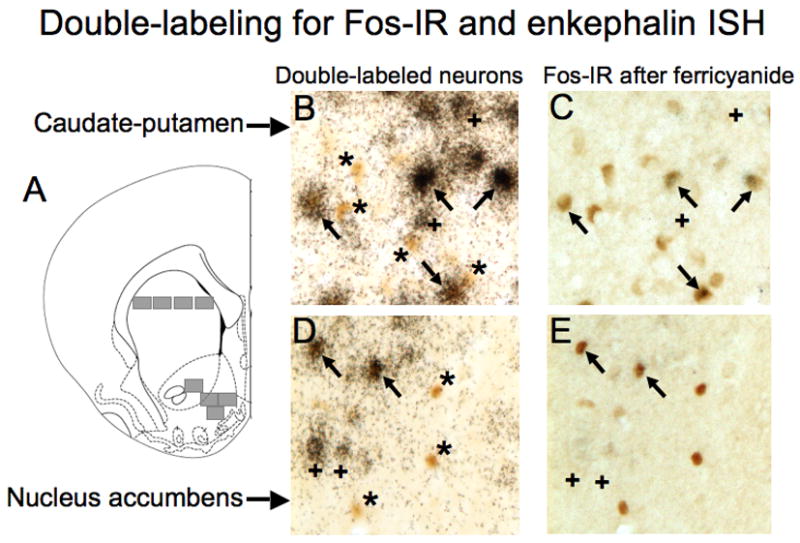
Figure 5.

Representative images of Fos-immunoreactive nuclei expressed in enkephalin-positive and enkephalin-negative neurons in the caudate-putamen (B,C) and nucleus accumbens (D,E) after repeated amphetamine administration in the locomotor activity chamber. (A) Schematic representation of brain regions captured for image analysis. Images were captured from areas indicated with gray rectangles from coronal sections approximately 2 mm anterior to Bregma. The size of each image was 0.4 × 0.34 mm with a total area of 0.14 mm2. Drawings of coronal section and coordinates were obtained from Paxinos and Watson (1998). (B,D) Photomicrographs (400X) of sections double-labeled for Fos-immunoreactive nuclei (brown, oval objects) and enkephalin mRNA (clusters of black silver grains). (C,E) Photomicrographs (400X) of same sections after reduction of silver grains with ferricyanide. Arrows indicate enkephalin-positive Fos-immunoreactive neurons. Asterisks indicate enkephalin-negative Fos-immunoreactive neurons. Cross signs indicate enkephalin-positive Fos negative neurons.
