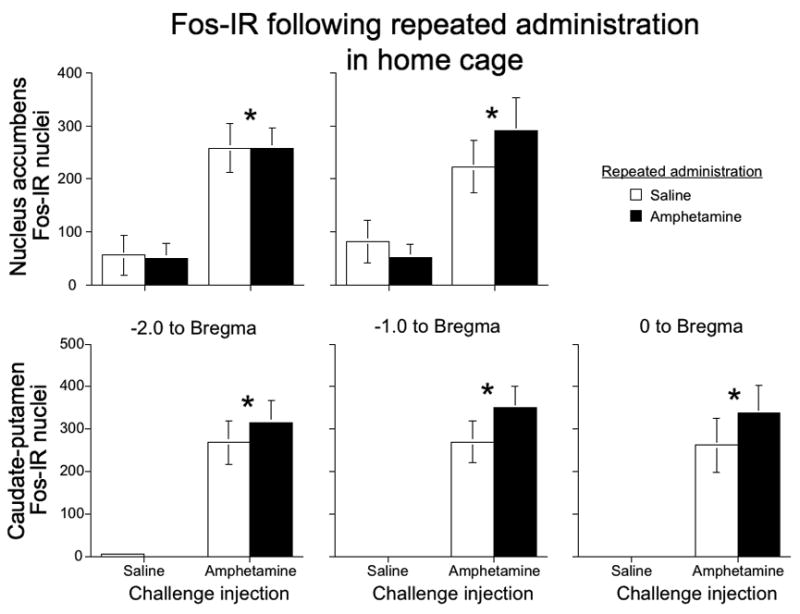
Figure 7.

Amphetamine-induced Fos expression after repeated drug administration in the home cage. Graphs indicate the number of Fos-IR nuclei in nucleus accumbens (top row) and caudate-putamen (bottom row) at 2, 1, and 0 mm anterior to Bregma following challenge injections of 1 mg/kg amphetamine or saline after repeated administration of amphetamine or saline. Values represent mean±SEM (n=6–8 per group). * indicates significantly more Fos-IR induced by challenge injections of amphetamine; no significant differences between repeated administration of amphetamine and saline.
