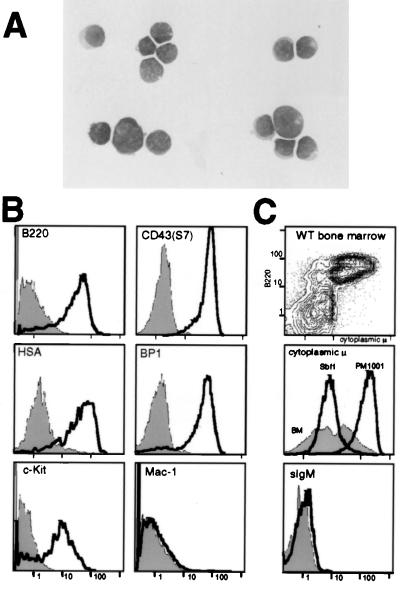
Figure 4.
Morphology and phenotype of cells expressing Sbf1. (A) Wright-Giemsa-stained cytospin preparation of Whitlock-Witte culture-derived cells. (B) Flow cytometric analysis of surface antigen expression. Solid lines represent staining obtained with conjugated antibodies specific for the indicated hematopoietic cell surface antigens (exception of HSA that employed unconjugated primary). Gray histograms represent background fluorescence on unstained cells (staining with secondary antibody only for HSA). (C) Expression of Ig in Sbf1 immortalized B cells. (Top) Staining for cytoplasmic μ and B220 in uninfected bone marrow. (Middle) Staining for cytoplasmic μ in uninfected bone marrow (same analysis as Top, gray histogram), a positive cell line (PM1001, thin line) and Sbf1-immortalized cells (thick line). (Bottom) Absence of surface IgM staining in Sbf1-immortalized cells (thick line) and unstained control (gray histogram).

