Fig. 1.

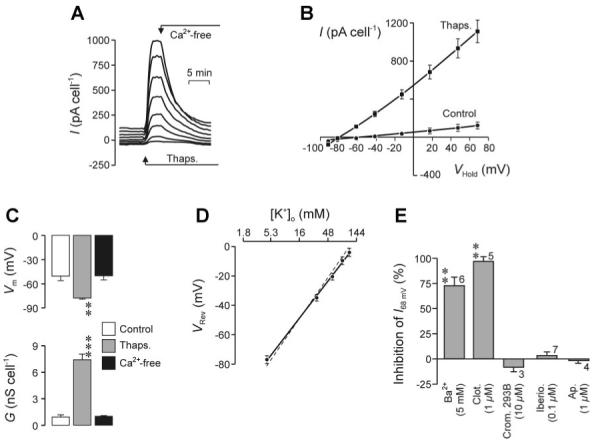
Thapsigargin-evoked membrane currents in H441 cells. A: cells were continuously superfused with physiological saline and, every 15 s, holding potential (VHold) was driven thorough a staircase containing 8 distinct voltage steps (-92, -82, -62, -42, -13, 17, 47, and 68 mV). The mean current flowing at each such value of VHold was then determined and plotted against time; cells were exposed to thapsigargin (1 μM) and nominally Ca2+-free saline as indicated. I, current. B: pooled data (n = 9) showing the relationship between I (means ± SE) and VHold during superfusion with standard saline and at the peak of the response to thapsigargin; data averaged from 4-6 consecutive pulse protocols. C: means ± SE values of membrane conductance (GTot) and membrane potential (Vm) determined from regression analysis of data collected under control conditions, at the peak of the response to thapsigargin, and after 10- to 15-min exposure to Ca2+-free solution. Statistically significant deviations from control (Student’s paired t-test): ***P < 0.001, **P < 0.02. D: relationship between extracellular K+ concentration ([K+]o) and Vm (inferred from VRev) in thapsigargin-stimulated cells (n = 5, means ± SE); the solid line was fitted to the data by least-squares regression (R2 = 0.997, P < 0.001), whereas the dashed line shows the solution to the Nernst equation for a selective K+ conductance. E: cells were stimulated with thapsigargin as shown in A and, once the characteristic rise in GTot and hyperpolarization of Vm were fully developed, exposed to putative K+ channel antagonists (Ba2+, clotrimazole, cromakalim 293B, iberiotoxin, or apamin). The effects of these compounds of were quantified (% inhibition) by determining the extent to which they blocked the current flowing at 68 mV (I68mV), a potential chosen because it equates to the equilibrium potential for Na+ (ENa), implying that I68mV will not contain a component carried by Na+. The results of this analysis are shown as means ± SE for values of n indicated beside each column. Statistically significant inhibitory effects (Student’s paired t-test): **P < 0.005.
