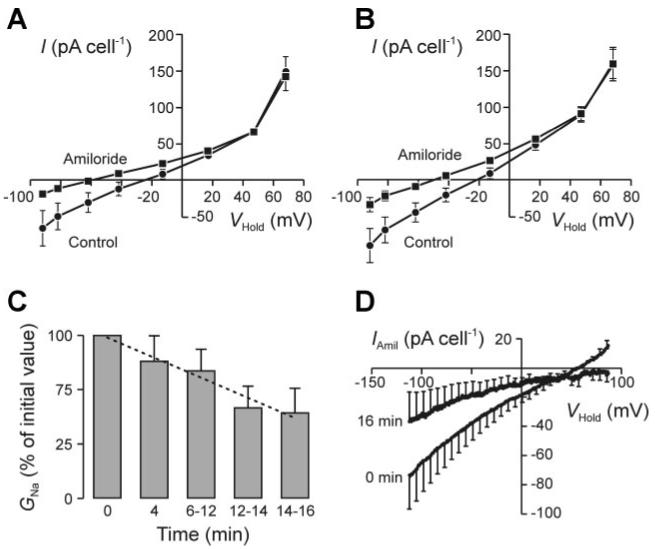
Fig. 2.

Effects of thapsigargin on Na+ conductance (GNa). A: membrane currents (n = 9) recorded from clotrimazole-treated (3 μM) H441 cells under control conditions and after application of 10 μM amiloride with the “staircase” protocol described in Fig. 1. B: analogous data derived from the same cells after ∼4-min exposure to 1 μM thapsigargin. C: data from experiments in which membrane currents were evoked by driving VHold through ramps from -113 to 87 mV in 1.75 s. At the onset of each experiment such data were collected both under standard conditions and after 30- to 40-s exposure to amiloride (10 μM). This drug was then washed from the bath, the cells exposed to thapsigargin (1 μM), and the entire protocol repeated at 2- to 4-min intervals over the following 16 min. Values of GNa were determined by analysis of these data, normalized to the initial value measured under control conditions at the onset of the experiment, and plotted (means ± SE) against the duration of exposure to thapsigargin; the dashed line was fitted to the data by least-squares regression and thus shows the relationship between GNa and time (R2 = 0.955, P < 0.001). D: relationship between the amiloride-sensitive component of the total membrane current (IAmil) and VHold determined (n = 6; means ± SE) under control conditions and after 16-min exposure to thapsigargin.
