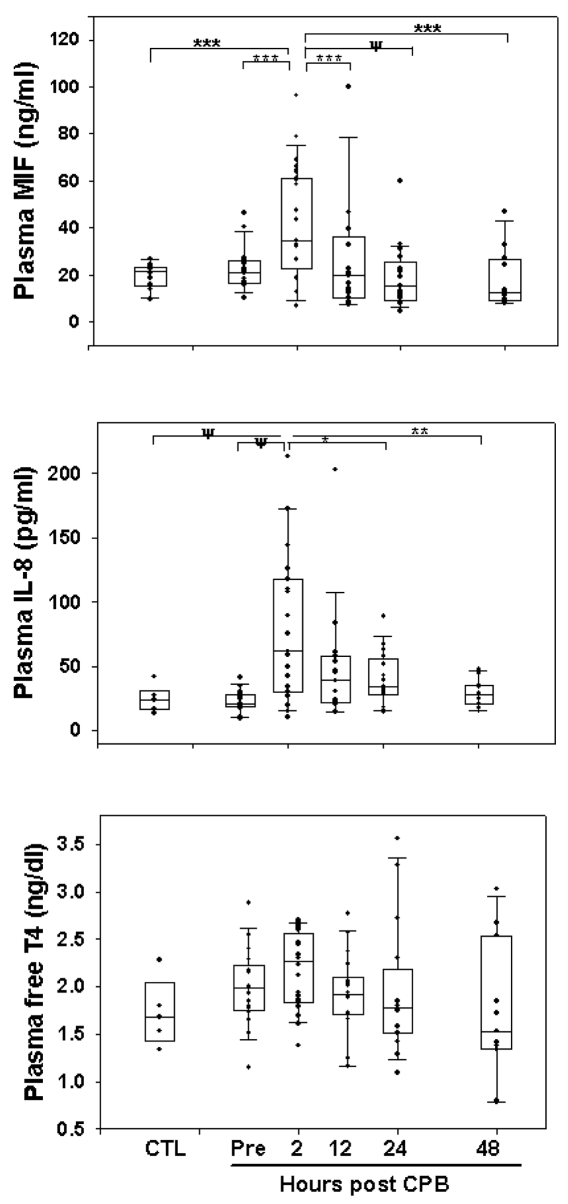
Figure 1.
Circulating MIF, IL-8, and fT4 in control (CTL) healthy children and in pediatric patients before and after CPB surgery. Box plot encompasses 25th to 75th percentiles, the horizontal line is the median value, and the caps represent 10th and 90th percentiles. Significant differences between time points analyzed by RM-ANOVA are indicated: ψP = 0.0001; ***P = 0.001; **P = 0.005; *P = 0.02.

