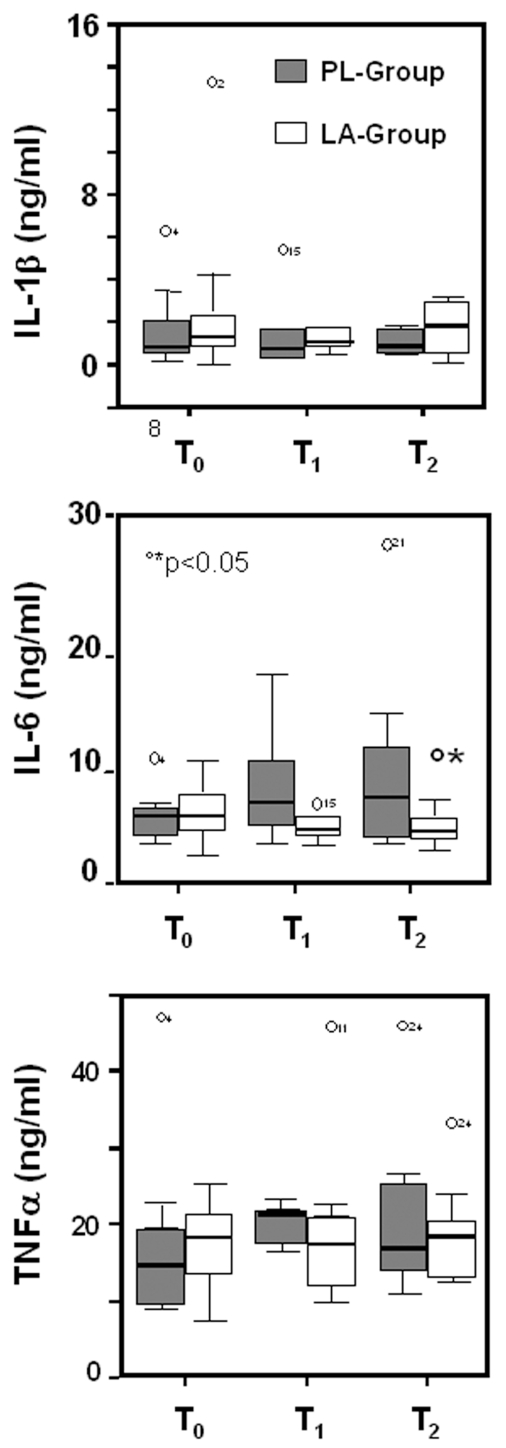
Figure 4.
Box plots showing plasma concentrations of IL-1β, IL-6, and TNFα proteins in LA-supplemented and control subjects undergoing HBO therapy. IL-1β, IL-6, and TNFα protein levels were assessed in plasma of supplemented (LA-group) and non-supplemented (PL-group) subjects at the first HBO session (T0), at the seventh HBO session (T1), and day 14 of HBO therapy (T2). Results are expressed as ng/mL. The lines in the boxes represent the median values. Lines extend to the minimum and maximum values, excluding the outliers (circles). °T1 and T2 versus T0; *LA-group compared with PL-group, P < 0.05.

