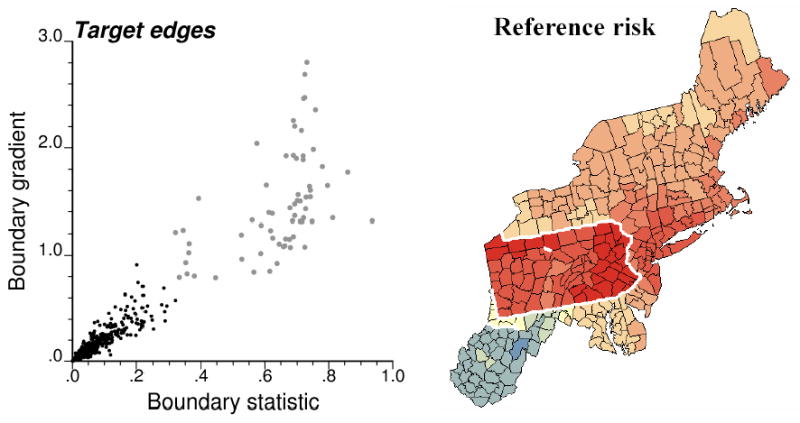
Figure 2.

Scattergram of the boundary statistic versus a measure of spatial gradient (i.e. boundary statistic divided by Euclidian distance between centroids) for all 781 pairs of adjacent counties in the New England dataset. Large grey dots depict the target edges that are represented with thick white lines in the reference risk map.
