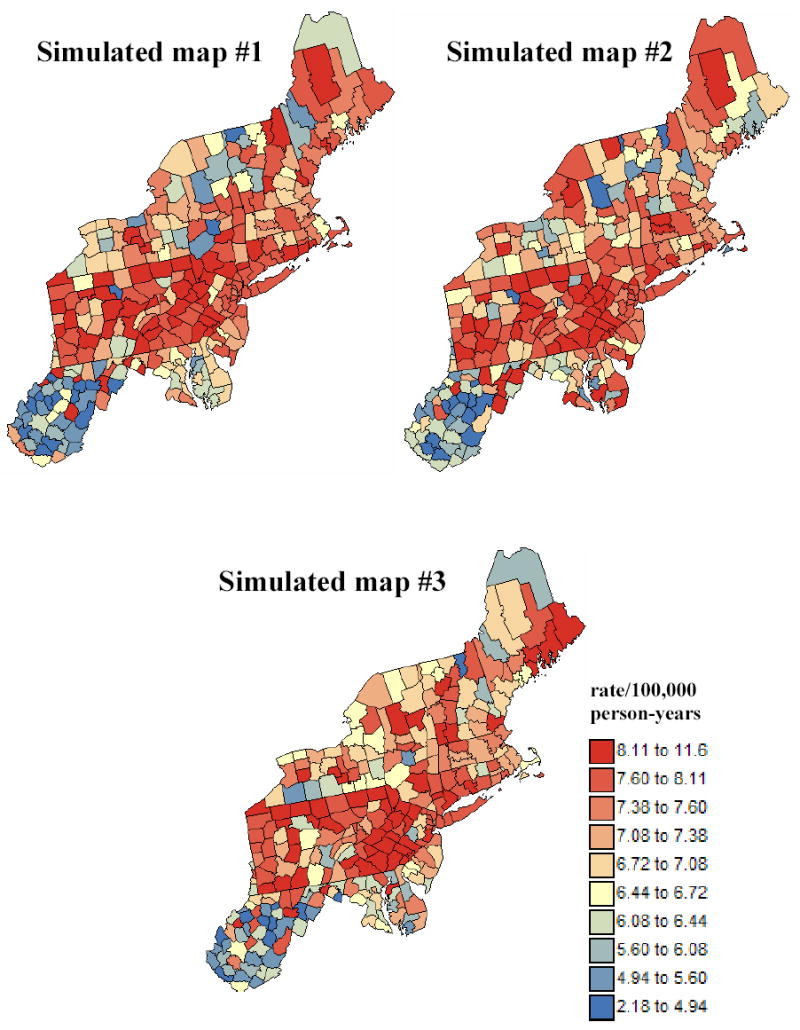
Figure 3.

Three realizations of the spatial distribution of pancreatic cancer mortality rates generated using Poisson simulation with the reference risk and population maps displayed in Figure 1. The units are age-adjusted mortality rates per 100,000 person-years.
