
Figure 5.
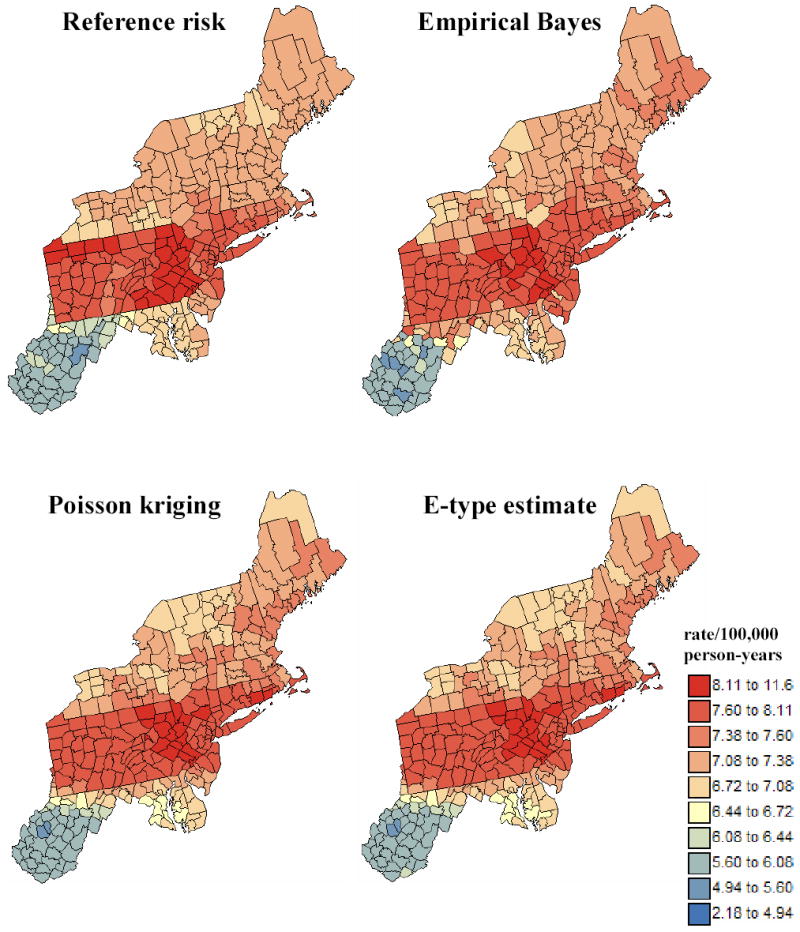
Maps of reference risk values and estimates obtained from the first simulated rate map by application of local empirical Bayes smoother, Poisson kriging, and averaging of 100 realizations generated using p-field simulation (E-type estimate). The units are age-adjusted mortality rates per 100,000 person-years.