
Figure 7.
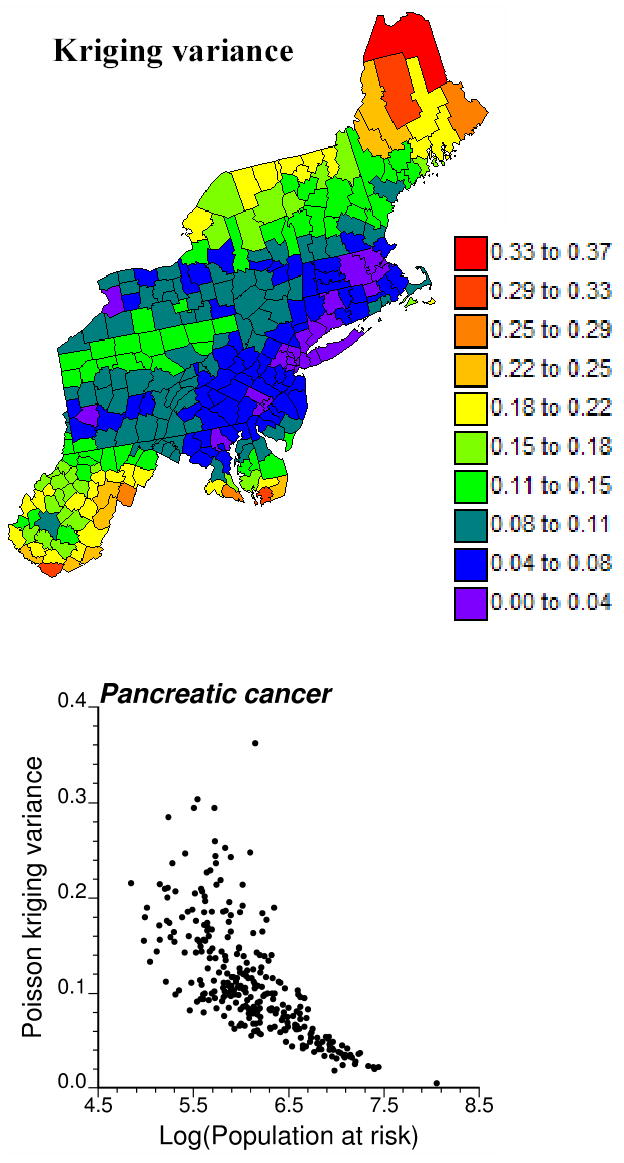
Map of the Poisson kriging variance and scattergram that illustrates the greater uncertainty of the risk estimated for sparsely populated counties.
Official websites use .gov
A
.gov website belongs to an official
government organization in the United States.
Secure .gov websites use HTTPS
A lock (
) or https:// means you've safely
connected to the .gov website. Share sensitive
information only on official, secure websites.
Map of the Poisson kriging variance and scattergram that illustrates the greater uncertainty of the risk estimated for sparsely populated counties.