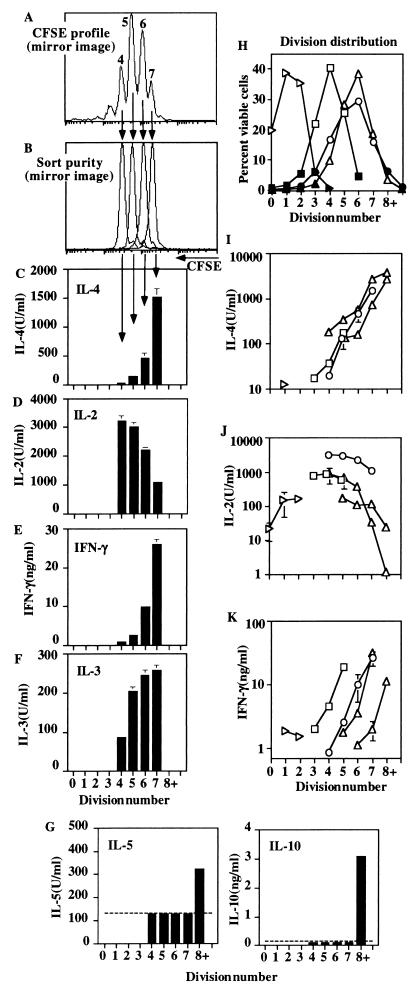
Figure 2.
Division-related changes in secretion of IL-4, IL-2, and IFN-γ. Naive, CD4+ T cells labeled with CFSE were stimulated with anti-CD3, IL-2, and IL-4 after which the asynchronously dividing population was harvested and sorted according to CFSE intensity. Each sorted population was restimulated with anti-CD3 at 106 cells/ml for 24 h before harvesting supernatant. (A) To align with plots of division number the mirror image of a day 4 CFSE profile from which cells were sorted is presented. The brightest (least divided) cells are at the left. (B) Overlay of CFSE histograms showing the cells after sorting into populations of uniform division number. (C) IL-4 secreted by cells in divisions 4–7. Similar assays were conducted for (D) IL-2, (E) IFN-γ, and (F) IL-3. Each column represents the mean and standard error of at least three replicates. (G) Detection of IL-5 and IL-10 from a representative day 5 culture. (H–K) Purified naive, CFSE-labeled T cells were stimulated in primary culture for either 2 (▹), 3 (□), 4 (○), or 5 (▵) days (two experiments) followed by cell sorting by division, restimulation with anti-CD3 and harvest of 24-h supernatants. Each point shows the mean and standard error of at least three separate cultures except divisions 8+ (single samples) for each day 5 experiment and day 3 division 3, which is in duplicate. (H) The proportion of viable cells found in each division at each time point. Divisions represented by open symbols were sorted for restimulation. Where possible, overlapping division cycles were selected at consecutive time points. Supernatants were analyzed for the presence of (I) IL-4, (J) IL-2, or (K) IFN-γ.

