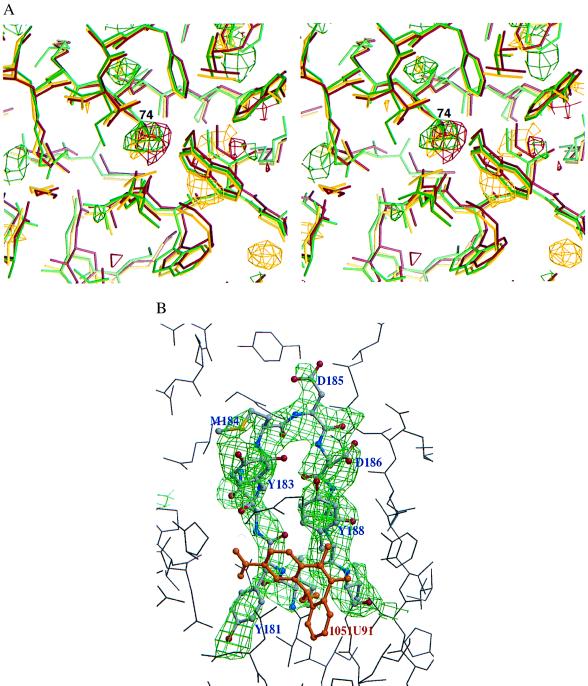
Figure 2.
Electron density maps. (a) A stereodiagram of Fo-Fc maps contoured at −2.5σ showing the negative electron density at residue 74 of the p51 subunit, indicating the Leu to Val substitution. The largest negative feature in the map was close to the inhibitor, which had been omitted from the model. The electron density and models for RTL74V-1, RTL74V-2, and RTL74V-3 are colored as red, yellow, and green, respectively. (b) An omit Fo-Fc map for the RTMC-1 data set contoured at 2.5σ showing the electron density for residues 180–189. The map was calculated from a model obtained by further refinement after removing these residues.

