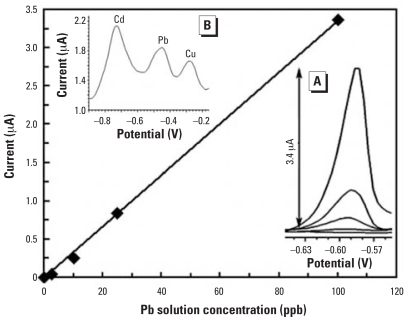
Figure 7.
A Pb calibration curve at a 10 wt% AcPhos–SAMMS screen-printed sensor after 5-min preconcentration. Inset (A) shows the corresponding Pb voltammograms; inset (B) shows the simultaneous detection of 90 ppb Cd, 18 ppb Pb, and 18 ppb Cu. y = 0.034x; R2 = 0.999. Reproduced from Yantasee et al. (2005a), with permission of Elsevier.

