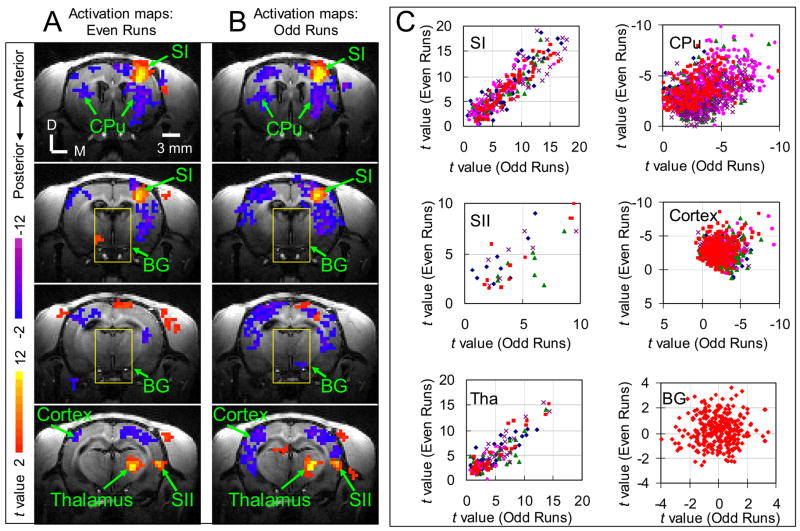
Fig. 3. Reproducibility of stimulation-induced activations.
fMRI measurements of stimulus strength dependence study were divided into two sub-groups, consisting of either even or odd runs. From these subsets, separate activation maps were derived and shown in (A) and (B). The t values within the ROIs (indicated by arrows) of activated regions and backgrounds (BG, as in yellow box) for two subsets are plotted against each other in (C) with red data points representing the data from the animal shown in (A) and (B) and other color data points showing data from the remaining animals (one color corresponds to one animal). For the red data points, the cross correlation values are 0.93 (p = 1.5 × 10−41) for SI, 0.9 (p = 3.4 × 10⁻⁶) for SII, 0.93 (p = 5.6 × 10⁻²¹) for thalamus, 0.48 (p = 9.0 × 10⁻¹³) for CPu, 0.17 (p = 1.3 × 10⁻³) for cortical regions with negative response, and 0.06 (p = 0.3) for background regions. D: Dorsal; M: Medial. Cortex: cortical regions with negative response. BG: background regions as indicated by yellow boxes in (A) and (B).

