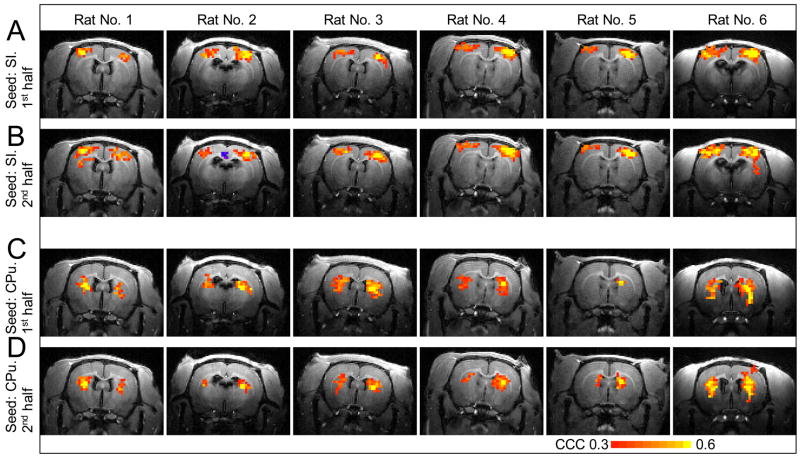
Fig. 7. Reproducibility of resting-state connectivity.
A 10-minutes fMRI run without stimulation was divided into two 5-minutes subsets. From these subsets, cross-correlation coefficient (CCC) maps were calculated by correlating the time course of pixels with the time course of the seed in SI (A, B) and with the time course of the seed in CPu (C, D). Rats 1–5 correspond to those shown in Fig. 6 and rat 6 is the one whose data is displayed in Fig. 4.

