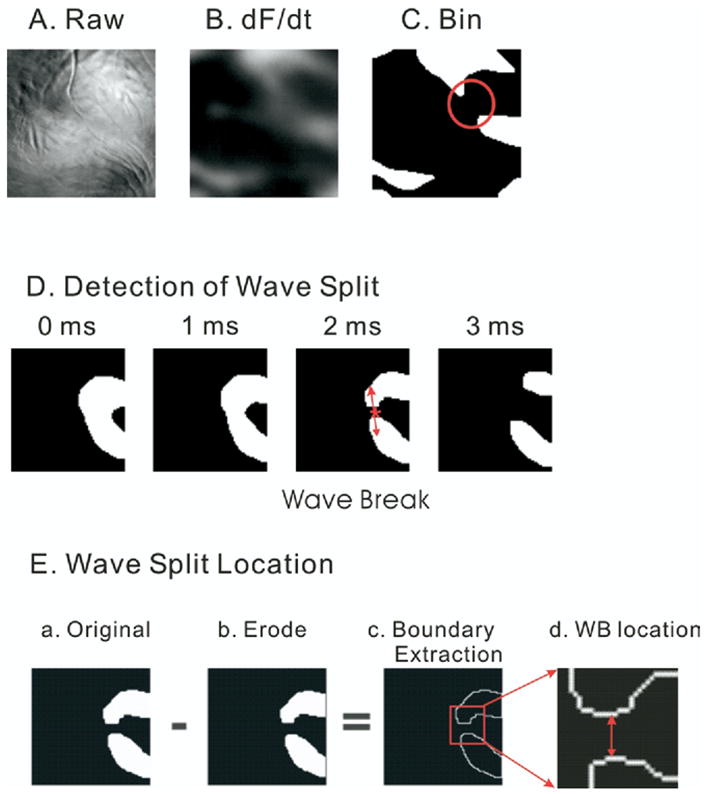
Figure 2.

Wave split detection. Wavelets were isolated from the first derivatives of transmembrane potentials, and the split of single wave into multiple wavelets was automatically detected (see Methods). A: Raw image. B: First derivatives. C: Binary image. D: Split of wavefronts. A sequence of wavefront images is shown in a 1-ms interval. Here, a single wavefront splits into two wavefronts. Note that once the split occurs at the 2-ms time frame, the waves spread apart rapidly and are more than 15 pixels apart within 1 ms (see 3-ms frame). This highlights the need for a frame rate of 2,000 frames per second. E: Detection of wave split location. The original wavefront image (panel a) is subtracted by the same image after applying the erode operator (panel b) to produce an image of the edges of the wavefronts (panel c). The boundary pixel extraction (panel c) generated by subtracting the eroded image (panel c) from the original image (panel a) was used to determine the wave split location by selecting the midpoint between the edges of the daughter wavelets (panel d, see Methods).
