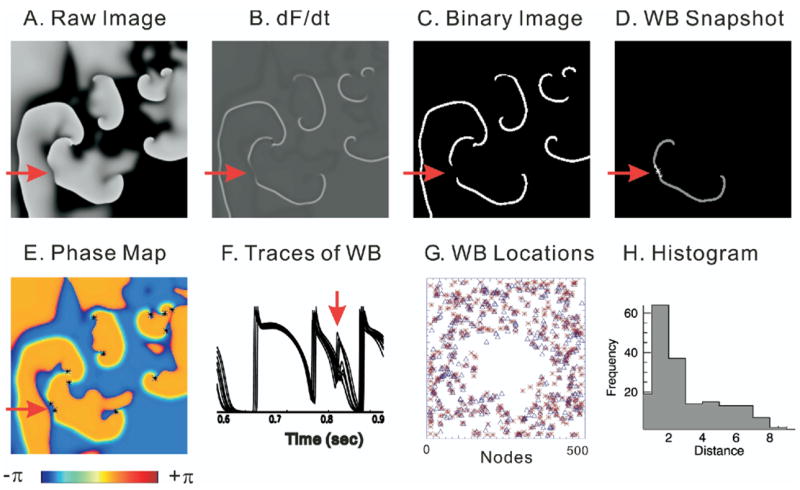
Figure 3.

Comparison of wavebreak (WB) detection algorithms. WB locations were detected by digital image analysis routines and compared to detection of WBs by the time-embedding phase reconstruction method35 by applying the two algorithms to the computer simulation data based on a canine ventricular model.25 A: Snapshot of Vm from computer-simulated ventricular fibrillation (VF) data (black to white represents the range of Vm from polarized to depolarized). B: Map of the first derivative of Vm (dF/dt), which is used to identify activation time points and visualize wavefronts during VF. C: Binary image of dF/dt taken from panel B. D: WB location detected by digital image analysis routines. E: Phase map. Phase singularities are marked with asterisk. Red arrow indicates an example of a WB that created two phase singularities with opposite chirality. F: Superimposed traces of Vm from neighboring pixels surrounding the WB point shown in panel D. G: Map of WB locations. WBs detected with phase singularity algorithm are marked with asterisks. WBs detected by digital image routines are marked with open triangles. H: Histogram of distance between WBs detected by the two methods. Average distance was 2.8 ± 2.1 pixels (n = 185 WBs).
