
Figure 7.
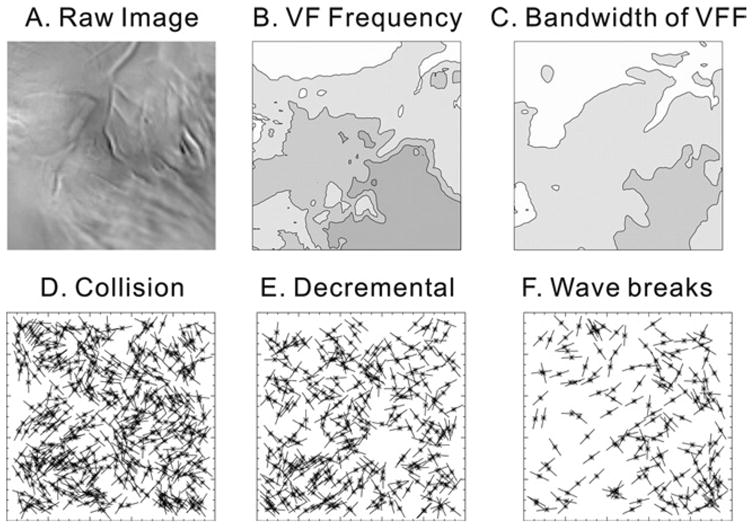
Wavebreak locations. A: Raw image. B: Power spectral density map. Power spectral density was calculated from all the pixels and mapped as described in the Methods. Contour lines are drawn every 1 Hz from 11–16 Hz. C: Bandwidth map of power spectral density (1-Hz isolines, 4–6 Hz). D: Sites of collision. Locations are marked with an asterisk and line for the tangent angles of wavefronts. E: Sites of wave split during decremental conduction. F: Sites of wavebreaks due to dispersion of repolarization at the site of wavebreaks. None of the cases showed possible relationship with Fast Fourier Transformation (FFT) distribution in panel B.