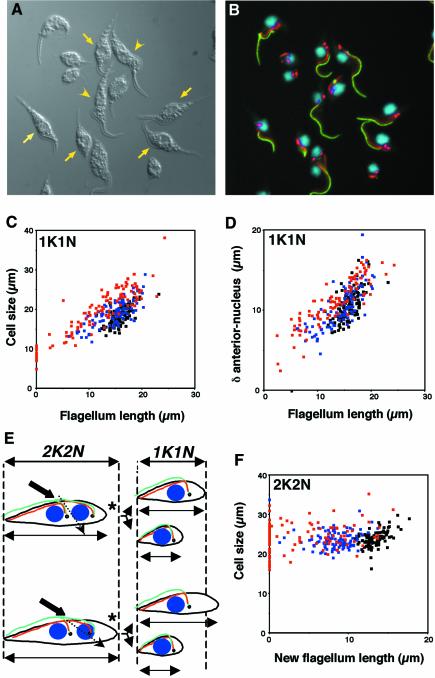
Fig. 3. Flagellum length controls cell size. (A and B) Field of (TbDHC1b) RNAi trypanosomes induced for 48 h. Flagellum was labelled with L8C4 (green), FAZ filament with L6B3 (red lines), basal body with BBA4 (red spots) and DNA was stained with DAPI (blue). (A) DIC image; (B) merged fluorescence. Cells with a shorter flagellum appeared smaller (arrows) than cells with a normal flagellum (arrowheads). (C, D and F) (TbDHC1b) RNAi trypanosomes were non-induced (black squares), or induced for 24 h (blue) or 48 h (red). (C) Mononucleated cells. Cell body size was measured and plotted versus the measured flagellum length. Each point represents an individual cell. (D) In the same uniflagellated trypanosomes, the distance between the anterior tip of the cell and the kinetoplast was measured and plotted versus flagellum length. Non-flagellated cells were not included, as recognition of the posterior/anterior end is virtually impossible. (E) Two models for the generation of small cells with short flagella. The nucleus is shown in blue, the flagellum in green, the FAZ in red and the basal body/kinetoplast (shown as a single circle for simplicity) in black. The asterisk indicates the posterior end. Normal cell size of a binucleated (‘2K2N’) or of a uninucleated (‘1K1N’) trypanosome is delimited by the dashed lines. Point of cleavage initiation is indicated by the thick arrow and probable cleavage progression by the dashed arrow (see text). (F) Binucleated cells. Cell size was measured and plotted versus new flagellum length.

An official website of the United States government
Here's how you know
Official websites use .gov
A
.gov website belongs to an official
government organization in the United States.
Secure .gov websites use HTTPS
A lock (
) or https:// means you've safely
connected to the .gov website. Share sensitive
information only on official, secure websites.
