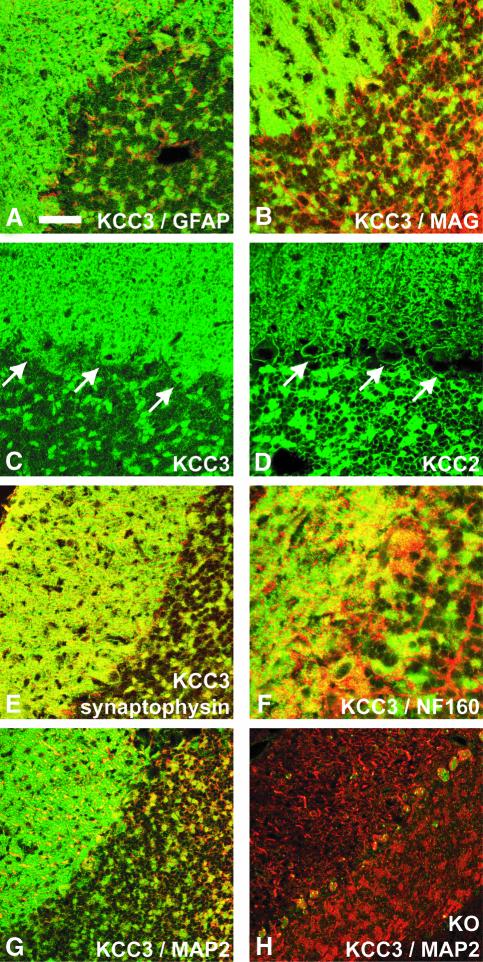
Fig. 3.Subcellular distribution of KCC3 in the cerebellum. There was no significant overlap of KCC3 staining (green) with the glial marker proteins GFAP (A) or MAG (B) (red). (C) KCC3 was present in the plasma membrane and cell interior of cerebellar Purkinje cells (arrows). (D) KCC2 was almost exclusively in the plasma membrane of Purkinje cells (arrows). (E) KCC3 staining (green) largely co-localized with synaptophysin (red), a marker for synapses. (F) Staining for KCC3 (green) and neurofilament (red), a marker for axons, overlapped rarely. This was also the case when KCC3 (green) is compared with MAP2 (red), a marker for dendrites (G). (H) Staining for KCC3 of a KO mouse. The scale bar corresponds to 28 µm in (A)–(E), 18 µm in (F), and 39 µm in (G) and (H).

An official website of the United States government
Here's how you know
Official websites use .gov
A
.gov website belongs to an official
government organization in the United States.
Secure .gov websites use HTTPS
A lock (
) or https:// means you've safely
connected to the .gov website. Share sensitive
information only on official, secure websites.
