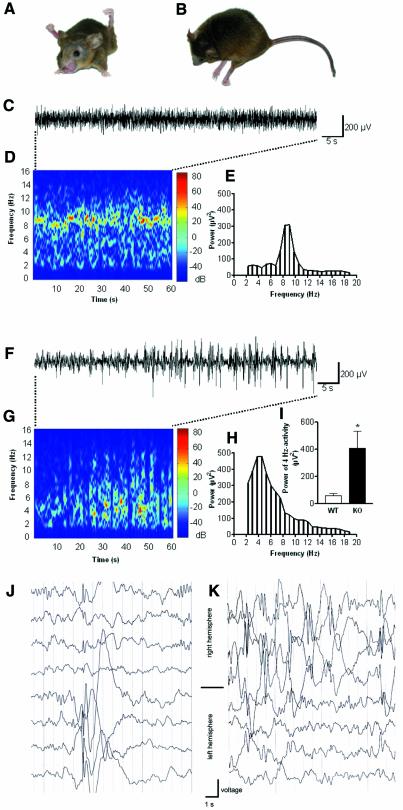
Fig. 4.Neuronal phenotype of Kcc3–/– mice. (A) Abnormal posture of a 15-month-old KO mouse reminiscent of spasticity. (B) Another KO mouse lay flat on the ground. (C–I) ECoG analysis. Comparison of WT (C–E and I) and KO animals (F–I). (C) Original trace of field potential recording in a freely moving WT control. (D) Colour-coded power spectrum of the trace illustrated in (C). Note activity at 7–10 Hz. (E) Conventional fast Fourier transformation (FFT) of the trace in (C) indicates a predominant frequency at 7–10 Hz. (F) Original trace in KO animal with spontaneous high-voltage spike-wave-like complexes. (G) Colour-coded power spectrum of the trace in (F). (H) Conventional FFT of this trace indicates a wideband frequency range with a peak at 4 Hz. (I) Comparison of the power of the 4 Hz activity. KO mice (n = 6) showed a significantly higher power of the 4 Hz activity (P <0.005) compared with WT (n = 6). (J and K) Electroencephalograms (EEGs) from two patients carrying a homozygous missense mutation in the KCC3 gene.

An official website of the United States government
Here's how you know
Official websites use .gov
A
.gov website belongs to an official
government organization in the United States.
Secure .gov websites use HTTPS
A lock (
) or https:// means you've safely
connected to the .gov website. Share sensitive
information only on official, secure websites.
