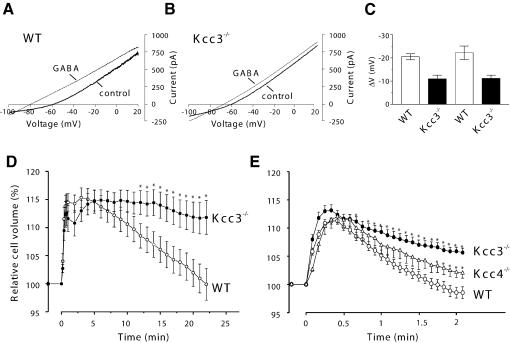
Fig. 8.Cell physiological effects of deleting KCC3. (A–C) Changes in neuronal [Cl–]i studied by perforated patch-clamp measurements of P12–P14 Purkinje cells. Representative I–V relationships of WT (A) and Kcc3–/– (B) Purkinje cells measured in voltage-clamp before (thick line) and after (thin line) applying 100 µM GABA. From –60 mV, cells were stepped for 80 ms to +20 mV and the voltage was reduced to –100 mV with a voltage ramp (150 mV/s). (C) Mean shift in voltage (± SEM) upon GABA application in either voltage clamp (first two bars) or current clamp mode of WT or KO cells. From the left, n = 4, 4, 8 and 6. The differences in GABA-induced hyperpolarization were significant at the P <0.05 level in either recording mode. The resting potentials were not significantly different between WT (–59.4 ± 1.7 mV) and KO (–60.0 ± 0.9 mV). (D and E) Cell volume regulation of cultured hippocampal pyramidal cells (D) and renal proximal tubular cells (E) of WT (open circles) and Kcc3–/– (filled circles) mice. (E) also includes data from Kcc4–/– (open triangles) mice. Cells were exposed to hypoosmotic medium (230 mosmol/l) at t = 0. Cell volume is expressed as a percent of the volume at t = 0. Error bars indicate SEM and asterisks significant differences from the WT (P <0.05). The numbers of measurements were: (D) 13 KO and 12 WT cells from four animals; (E) Kcc3–/–, 22 tubules from six mice; Kcc4–/–, 10 tubules from five mice; WT, 30 tubules from 11 mice.

An official website of the United States government
Here's how you know
Official websites use .gov
A
.gov website belongs to an official
government organization in the United States.
Secure .gov websites use HTTPS
A lock (
) or https:// means you've safely
connected to the .gov website. Share sensitive
information only on official, secure websites.
