Figure 4.
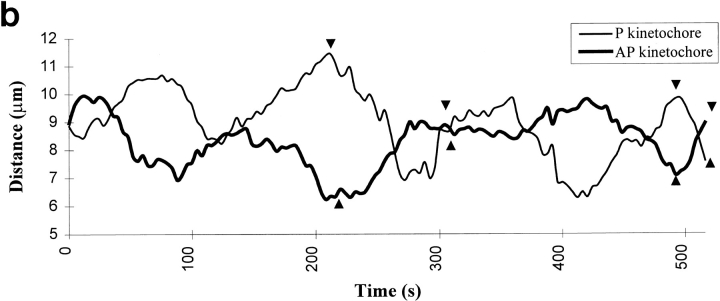
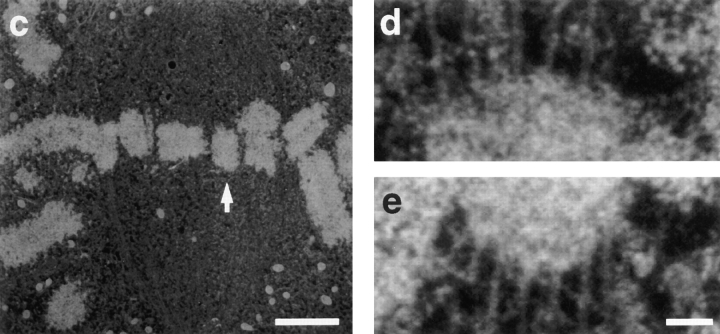
Correlating kMt numbers with the direction of motion of sister kinetochores on an oscillating metaphase chromosome. (a) Frames from the DIC video record showing the oscillating chromosome, indicated by black arrows. (b) Tracking record for sister kinetochores of the oscillating chromosome. Arrowheads correspond to frames shown in a. At fixation (512 s), one kinetochore is moving P and the other is moving AP. (c) A serial section electron micrograph of the cell. Oscillating chromosome is indicated by white arrow. (d) Electron micrograph enlarged to show the P kinetochore and its associated kMts. The kMts were counted in successive serial sections, as illustrated in Fig. 1. (e) Electron micrograph enlarged to show the AP kinetochore and its associated kMts. Bars: (a) 4 μm; (c) 2.2 μm; (d and e) 0.12 μm.


