Figure 6.
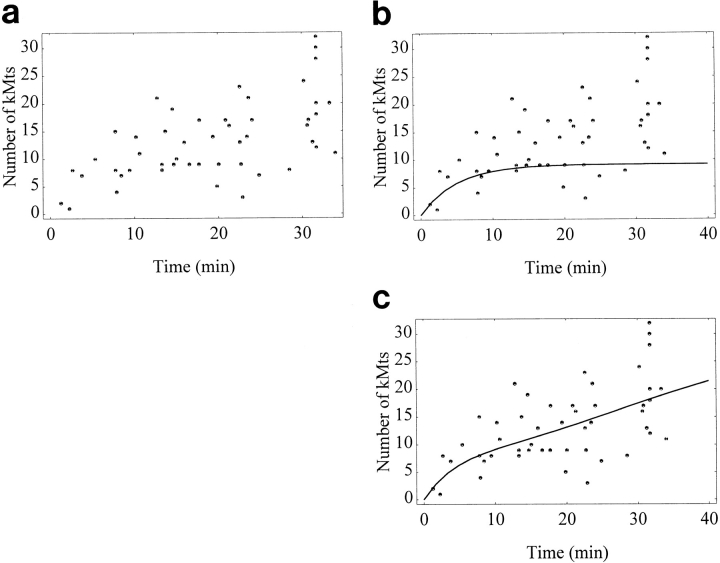
Time course for kMt acquisition. (a) Raw data. The length of time that monooriented, bioriented, and congressing chromosomes were attached to the spindle was determined from video records, as described in the text. (b) Curve predicted by a simple association/dissociation model (see Eq. 5). The association rate constant k 1 is estimated to be 0.053 from the earliest time points (see Eq. 4 a and text), the kMt value at saturation S is approximated as 35 kMts, and the dissociation rate constant k −1 is set at 0.15 kMt/min, based on a kMt half-life of 4.7 min at 37°C (Zhai et al., 1995). The resulting curve levels off at 9.2 kMts, far fewer than the 24 kMts observed at metaphase (Table IV). (c) Curve predicted by a model where k 1 increases with time (see Eq. 9). This curve is consistent with observations of both the initial rate of kMt acquisition and the kMt number at metaphase.

