
Figure 9.

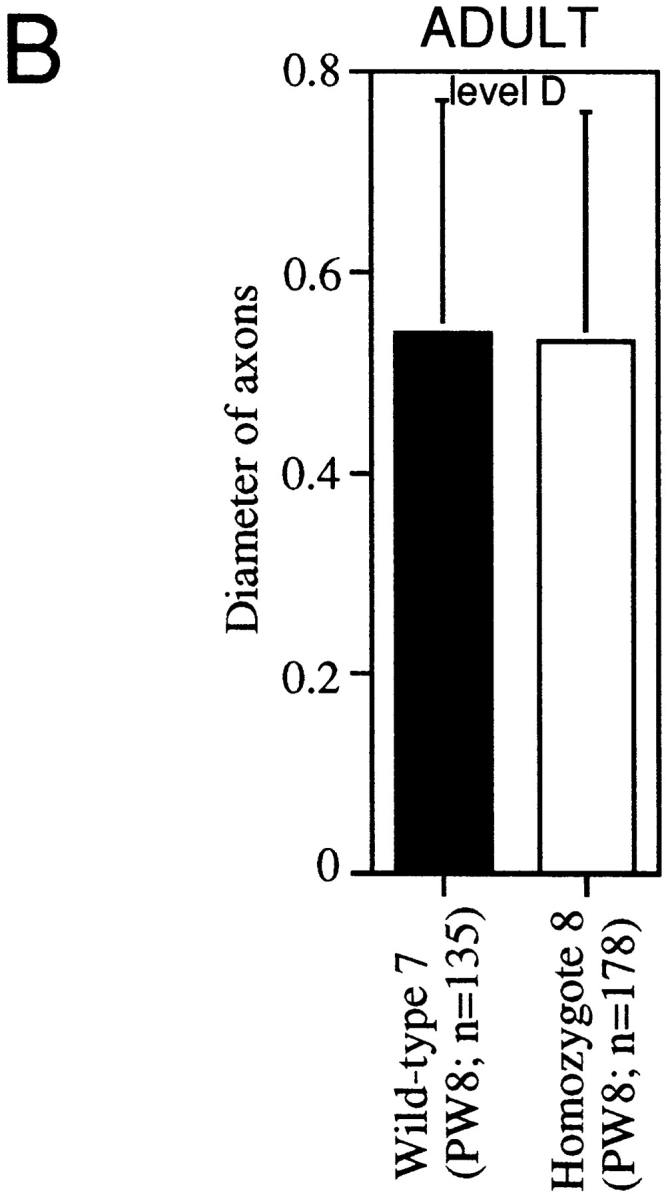
Quantitative comparison of the axonal diameters in juvenile (A) and adult (B) optic nerves of MAP1B+/+ and −/− mice. Solid bars represent mean values ± SD (μm) for axons in a MAP1B+/+ mouse. Open bars represent mean values ± SD (μm) for axons in a MAP1B −/− mouse. *Different from value for controls at P < 0.0005, ** at P < 10−8, and *** at P < 10−11. Student's t test was used to determine the significance of the differences. Levels A, B, C, and D are determined in the same way as described in Fig. 5 legend. PD, postnatal days; PW, postnatal weeks. n, the number of axons examined.