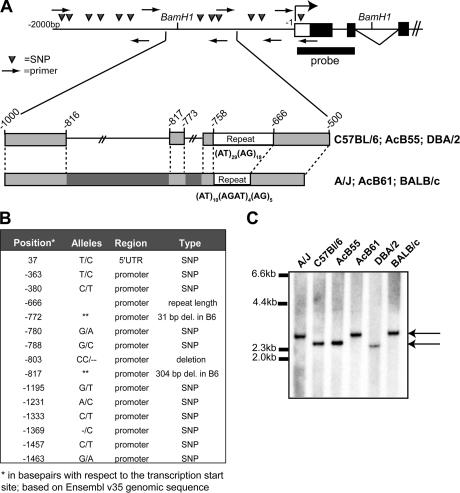
Figure 5.
Analysis of the Vnn3 proximal promoter region. Examination of the genomic sequence found upstream of the Vnn3 transcription start site. (A) A schematic representation of the genomic region in the putative proximal promoter of Vnn3. The 2,000 bp that were analyzed for nucleotide sequence integrity are displayed with PCR primers indicated by arrows and SNPs indicated by triangles. BamH1 restriction sites and the localization of the specific probe for Southern blotting are labeled. The major genomic rearrangement distinguishing the B6-like strains from the A/J-like strains is shown in greater detail with repeat regions and deleted regions indicated. (B) All identified polymorphisms in the promoter region are listed with respect to the reference (B6) genomic sequence. The double asterisks represent a deletion at this position. (C) The Southern blot from a BamH1 digest of genomic DNA displaying the size of the genomic rearrangement; A/J-like strains carry ∼340 bp of extra sequence. The arrows indicate the two distinct bands produced by the genomic rearrangement: the smaller band is representative of the B6-like promoters, and the larger band is representative of the A/J-like promoters.

