Figure 6.
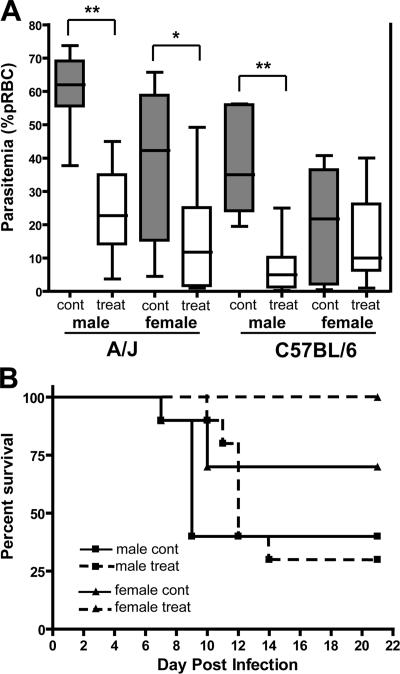
Administration of cystamine in vivo and the effect on P. chabaudi replication in A/J and B6 mice. The effect of cystamine treatment on P. chabaudi AS infection in A/J and B6 mice. (A) Male and female mice were treated with cystamine (120 mg/kg of body weight) or with PBS for 2 d before infection with 106 parasitized erythrocytes (pRBCs) and continuing daily for 15 d. Boxes and whisker plot shows parasitemia (percent pRBC) levels for 8–10 mice per group at day 7 after infection for control (gray bars) and treated mice (white bars). The median parasitemia is indicated by a horizontal line, whereas the box represents the quartiles, and the whiskers represent the end points of the parasitemia distribution. Error bars represent SEM. Statistical differences between groups are indicated by asterisks: **, P < 0.001; *, P < 0.02. (B) Effect of cystamine treatment on the survival of A/J mice after P. chabaudi AS infection. Dashed lines represent treated mice, whereas solid lines represent control animals. Cont, control; treat, treated; pRBC, parasitized RBC.

