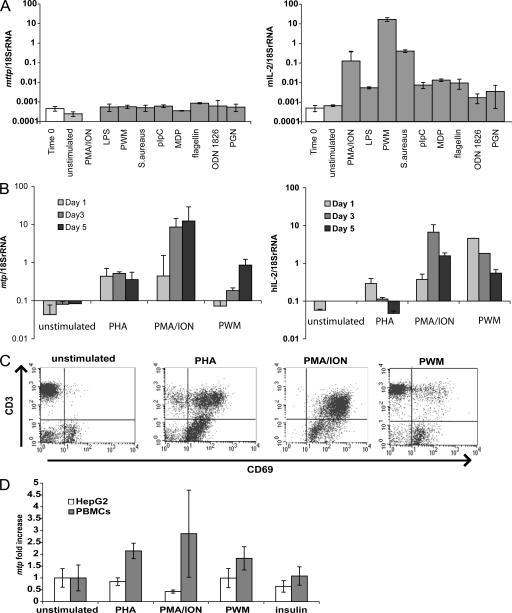
Figure 3.
Mouse and human MTP exhibit different mechanisms of transcriptional regulation. (A) Wild-type mouse splenocytes were stimulated for 24 h with the indicated compounds. Total RNA was harvested, and 1 μg was used for cDNA synthesis. MTP (left) and IL-2 (right) transcript levels were quantified by real-time PCR and adjusted to 18S rRNA levels. Both mttp and mttp_v1 are amplified in this assay. (B) Human PBMCs were stimulated for 1, 3, or 5 d with the indicated mitogens. MTP (left) and IL-2 (right) transcript levels were quantified by real-time PCR as in A. (C) Human PBMCs stimulated for 3 d with the indicated mitogens were stained with anti-CD3 and anti-CD69 and analyzed by flow cytometry. (D) HepG2 cells and human PBMCs were stimulated for 3 d with the indicated compounds. MTP transcript levels, quantified by real-time PCR as in A, are shown as the fold change compared with unstimulated cells. Values are ±SD.

