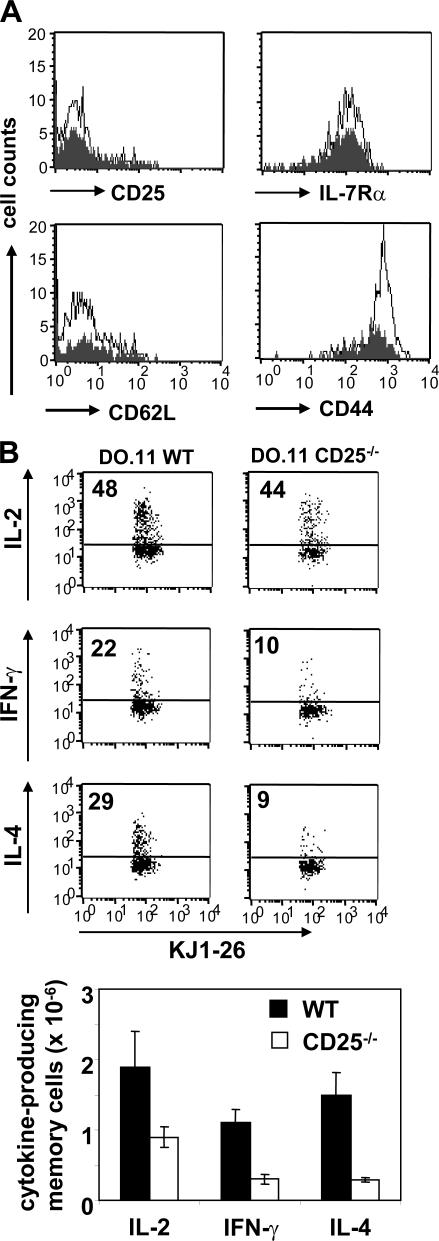
Figure 6.
Phenotypic and functional properties of memory cells generated in the absence of IL-2. 106 WT and CD25−/− DO.11 T cells were primed in vivo with 3 × 10⁶ OVA-pulsed DCs and analyzed 4 wk later. (A) Histograms show the phenotype of the WT (open) and CD25−/− (shaded) memory T cells recovered from the spleen. One representative mouse out of three is shown. (B) Some recipients were rechallenged with 3 × 10⁶ OVA-pulsed DCs, and 3 d later splenocytes were stained for cytokine production after brief in vitro restimulation. Dot plots show the frequency of IL-2–, IFN-γ–, and IL-4–producing cells within the CD4+ KJ1-26+ population. The bar graph shows total numbers of cytokine-producing DO.11 T cells. Error bars display SD (n = 3).

