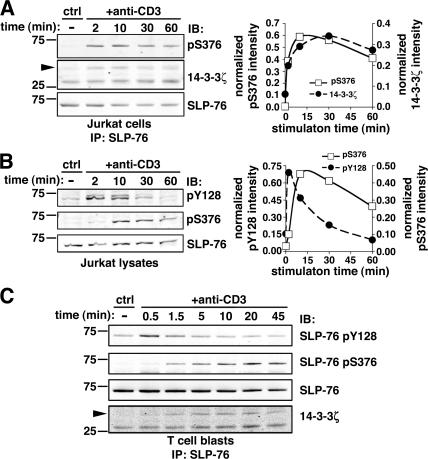
Figure 3.
Serine 376 phosphorylation is delayed as compared with tyrosine phosphorylation of SLP-76. (A) Jurkat cells were left unstimulated (ctrl) or incubated with 10 μg/ml anti-CD3 mAbs for the indicated time points. Cells were lysed and immunoprecipitated with an anti–SLP-76 mAb. Samples were then analyzed by Western blotting with anti-pS376 (top left) and anti–14-3-3ζ (middle row, left). Membranes were then stripped and reprobed with an anti–SLP-76 mAb (bottom row, left). Fluorescent immunoblots were acquired and quantified by using an Odyssey scanner. The graph (right) shows the quantification of band intensities in the pS376 (□) and 14-3-3ζ (•) immunoblotting, normalized by the amount of immunoprecipitated SLP-76. (B) Jurkat cells were left unstimulated or stimulated by anti-CD3 mAbs as described in A. SLP-76 phosphorylation was analyzed by immunoblotting with mAb anti-pY128 (top left) and affinity-purified rabbit anti-pS376 antibodies (middle row, left). Membranes were then stripped and reprobed with an anti–SLP-76 mAb (bottom row, left). Quantification of anti-pY128 and anti-pS376 and immunoblots, performed as explained in A, is shown on the right. (C) Human T cell blasts were stimulated with anti-CD3 mAb for the indicated time points. SLP-76 immunoprecipitates were subjected to anti-pY128 (top row), anti-pS376 (second row from top), anti–SLP-76 (third row from top), and anti–14-3-3ζ (bottom row) immunoblotting.

