Figure 5.
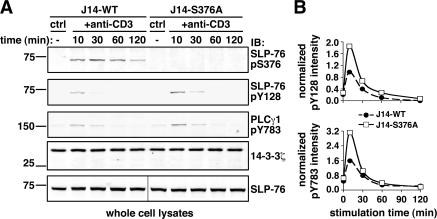
Increased SLP-76 and PLC-γ1 tyrosine phosphorylation in T cells expressing the SLP-76–S376A mutant. (A) J14-WT and J14-S376A cells were left unstimulated or stimulated by anti-CD3 mAb for the indicated time points. Lysates were fractionated on NuPAGE gel and immunoblotted with anti–SLP-76 pS376 (top row) and pY128 antibodies (second row from top), followed by anti–PLC-γ1 pY783 antibodies (third row from top). Equal protein loading in each lane was assessed by 14-3-3ζ immunoblotting (fourth row from top). Aliquots of the same lysates were analyzed on a separate gel to check for equal amount of SLP-76 constructs in all samples (bottom row). (B) Graphs show the comparison of SLP-76 (pY128; top) and PLCγ1 (pY783; bottom) phosphorylation in J14-WT (•) versus J14-S376A cells (□) after normalization for the amount of 14-3-3ζ in each sample.

