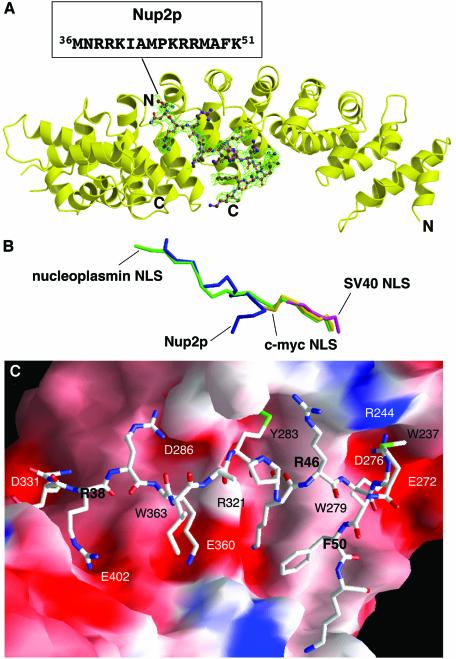
Fig. 2. Structure of residues 1–51 of Nup2p bound to Kap60Δ. (A) Overview of the Kap60Δ:Nup2N complex. The Fo – Fc omit map corresponding to the Nup2p fragment contoured at 2.5 σ and the refined model of Nup2p (residues 36–51) are superimposed. (B) Overlay of Nup2p with NLS peptides. The coordinates of Kap60Δ bound to Nup2N (blue) and the SV40 (purple), c-myc (yellow), and nucleoplasmin (green) NLSs (Conti et al., 1998; Conti and Kuriyan, 2000) were superimposed, then removed to show the relative positions of each ligand. Orientation as in (A). (A and B) were prepared with Bobscript (Esnouf, 1997) and Raster3D (Merritt and Bacon, 1997). (C) Molecular surface of Kap60Δ coloured by electrostatic potential shaded from –13 kT/e (red) to +13 kT/e (blue) (calculated with Nup2N removed using GRASP; Nicholls et al., 1991) shows acidic pockets and a nonpolar surface that recognize Nup2p. Nup2p residues are bold.

An official website of the United States government
Here's how you know
Official websites use .gov
A
.gov website belongs to an official
government organization in the United States.
Secure .gov websites use HTTPS
A lock (
) or https:// means you've safely
connected to the .gov website. Share sensitive
information only on official, secure websites.
