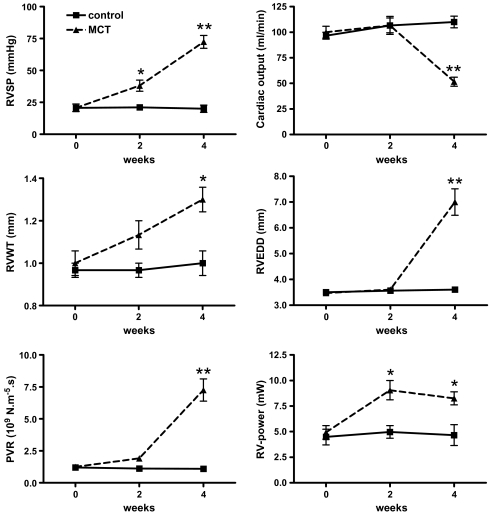
Fig. 2.
Haemodynamic changes during the development of MCT-induced pulmonary hypertension. Four weeks after the rats received MCT, clinical signs of RV heart failure developed. In these 4 weeks, systolic pressures continued to rise, while cardiac output could not be maintained. The presence of RV remodelling was indicated by increased wall thickness and diameter. The pulmonary vascular resistance continued to rise as well, while at 4 weeks, the increase in the RV-power was inadequate to compensate for the dramatically increased afterload. Triangles connected by dashed lines: MCT-treated; squares connected by uninterrupted lines: control group; n = 3 for both groups. All values are in mean ± SEM, Asterisk, p < 0.05; double asterisk, p < 0.01 compared to control (post-hoc analyses). Please note that sometimes the icons conceal the error bars. For explanation of the abbreviations, see corresponding text

