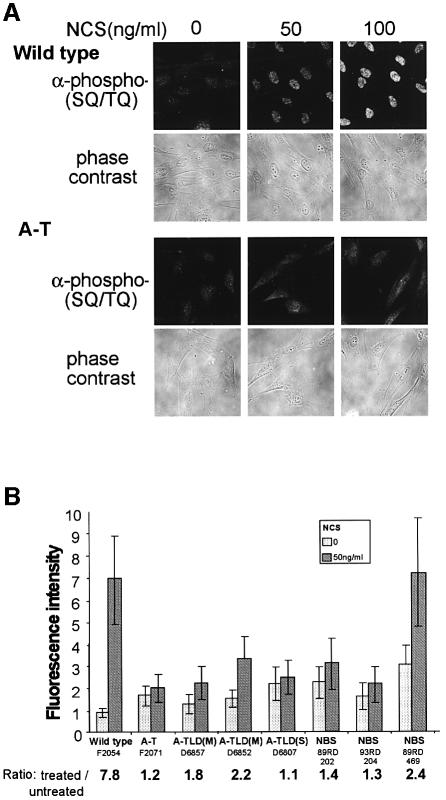
Fig. 5. Integrative visualization of phosphorylation of ATM substrates in human fibroblast lines in response to DSBs, visualized by immunostaining with an antibody raised against phosphorylated ATM target sequence (‘anti-phospho-[SQ/TQ]’). (A) Thirty minutes following NCS treatment, a vigorous response is observed in wild-type cells while the diffuse background staining in A-T cells is barely changed. Phase contrast images of the cells indicate that this response is confined to the nucleus. (B) Phosphorylation of ATM substrates in fibroblast cell lines with various genotypes following treatment with 50 ng/ml of NCS. Fluorescence intensity after staining with the anti-phospho-(SQ/TQ) antibody was averaged over ∼20 cells for each genotype and treatment. The numbers below the line represent the ratios between fluorescence values after NCS treatment and without treatment. Note the similar lack of response in A-T and A-TLD(S) cells and the variably low responses of all other genotypes. In some cell lines initial high level of phosphorylation is noticed. This constitutive damage response is occasionally observed in cells with defective damage response and represents elevated basal levels of DNA damage (Gatei et al., 2001; Kamsler et al., 2001).

An official website of the United States government
Here's how you know
Official websites use .gov
A
.gov website belongs to an official
government organization in the United States.
Secure .gov websites use HTTPS
A lock (
) or https:// means you've safely
connected to the .gov website. Share sensitive
information only on official, secure websites.
